Stock Market AI
Projects like trying to “solve” the market are fun because there’s a lot of data/literature out there already, the technical challenges are very interesting, and there’s always the 0.00000000001% chance that if you succeed you can get super mega rich. It’s for these reasons that I tried my hand at writing a stock market AI a while back.
The goal? Develop heuristics or some kind of training model that could make money in a simulated environment. I chose Python for this project because it’s fun to use and I wanted more experience with it.
More quantitatively, I wanted to see at least an 8% ROI on average. You can usually get that with a low cost index fund so any other approach that’s more effort should earn at least that.

Genetic Algorithms
Genetic algorithms simulate evolution by breaking solutions to a problem into "genomes" that you can mutate and combine with other genomes. Good solutions or "genomes" spread among your sample population while the weak solutions are removed.
Genetic algorithms are often a good fit for problems with massive solution spaces that can't be searched exhaustively. This is because their random mutations can stumble onto great answers that you couldn't have found iteratively. As such, it seemed like a good fit for this problem
AI Model
- buyThreshold: The percentage increase over the mean of the training data that was needed before the agent would buy the stock. This was a conservative approach that was mostly hoping to milk the natural ebbs and wanes of the market.
- maxLoss: the most a stock price can drop below the buy-in point before an agent would sell the stock and bail out.
- desiredProfit: How much the AI wants to make before it sells a stock.
To visualize results I wrote the stats for each top scoring genome to a csv file and then used D3 to style a simple scatterplot. This made it easy to understand what was happening and I could keep all my UI code separate in an HTML file.
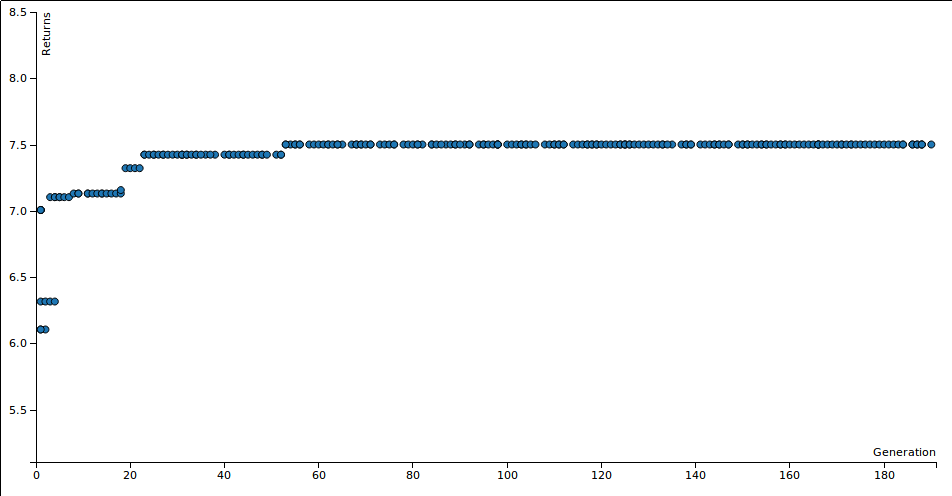
An example scatter plot is in the next section. These show how the profit (in percent) of the AI's chosen stocks grows over the generations of the simulation.
Overfitting
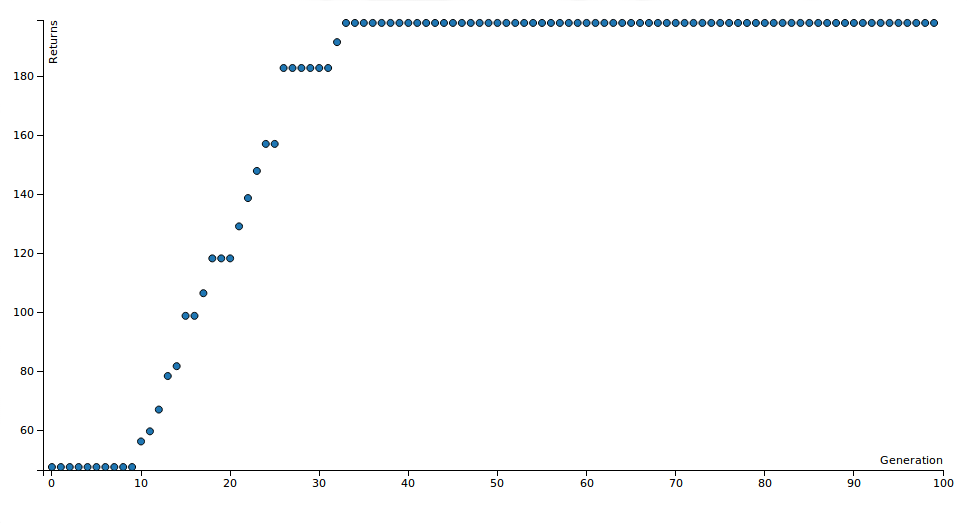
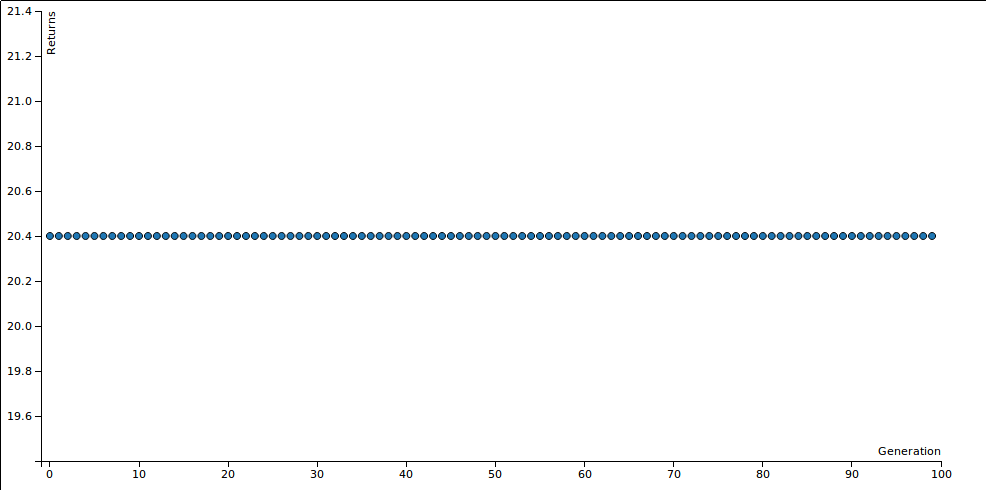
The way to avoid this is to use one set of data for training and another for validation. This way your algorithm doesn't just "memorize" the answer to the problem. As you can see below the AI basically just fine-tuned its parameters optimizing when to sell EQIX.
Stock data used in this experiment

[EQIX ] Optimal: 174.61
[PEP  ] Optimal:   0.32
[PRU  ] Optimal:   0.54
[RAI  ] Optimal:   0.85
[SRE  ] Optimal:   0.64
[WFC  ] Optimal:   0.34
...
Training time period used: January 2001 to December 2004
Gen 1 score: 47.4595647328, Last gen score: 198.285651689
score:198.286, total:18, profitable:18, bought:18, sold:1, maxLoss:-33.160%, desiredProfit:170.638%, buyThreshold:-6.713%
That desiredProfit is oddly specific, and is in fact targetted at maximizing the profit of the EQIX spike.
Exploration vs Exploitation
This is where exponential mutation fall off is handy. As my simulation moves from the 1st iteration towards the nth, I use a factor of

to decay the evolution rate (where x is the ratio of current generation to max generation). This allows for fine tuning of the evolved species, as it's likely that drastic mutations would destroy the value of the partially tuned parameters they already have. So in the first part of the simulation we mutate parameters by 20% but towards the end of the simulation it calms down to just a few percent.
I also tried a linear fall-off but this lead to exploration being too tame too early. The strains didn't have enough time to find a good solution and then we were just fine tuning bad solutions. Exponential had much better results.
Analyzing results
This could be inferred by taking top performers over hundreds of training sessions and looking for trends in their final parameters. So I let my testbench churn all day while I was at work and saved the best specimen from 1500 evaluations to a csv for later study. After importing the output into RStudio this is what I found:
> summary(data$desiredProfit)
   Min. 1st Qu.  Median    Mean 3rd Qu.    Max.
   0.67    3.54    8.41   13.29   17.38  172.90
> summary(data$buyThreshold)
   Min. 1st Qu.  Median    Mean 3rd Qu.    Max.
-105.20  -28.64  -15.38  -20.68   -7.58   -0.46
> summary(data$maxLoss)
   Min.  1st Qu.   Median     Mean  3rd Qu.     Max.
-113.100 -28.320 -14.600 -20.200 -6.912 -0.540 - desiredProfit (3% -> 17%): First off I'm glad these were all positive numbers. The AI learned that it likes selling stocks after they have gained between 3% and 17% in value. If an agent does not sell a stock by the end of the simulation I score it like the stock was sold on the last day, so sky high sell targets are not as smart as more reasonable exit strategies.
- buyThreshold (-28% -> -7%): Likewise I'm glad these were all negative numbers. buyThreshold is the difference between a stock's current price and the mean stock price the stock had while the AI observed the stock before it decided to buy it or not. The AI has learned to "buy low, sell high"! More specifically it will get in on a stock if there's a dip in the price, expected a price correction it can profit off of.
- maxLoss (-28% -> -6%): This is also negative because these are the points that an agent will pull the plug and sell a stock because it has lost too much value. This value is lower than I expected. This implies that the algorithm can stomach a fairly large price drop (the mean was 20%!) before it decides to cut its losses.
Other notes:
- Fitness function: Initially I used the average return of the AI's stocks as the fitness function that determined which agents got thrown out and which ones were kept. Well, if you have one stock that gets a 20% return and one that gets a 5% return, your average will go up if you stop buying the lower earning stock! The AI learned this quickly and started tuning parameters to only buy the most profitiable stock. This was a viable strategy but I was more interested in AI that would pick a portfolio of good stocks, so I used the total of the portfolio returns instead.
- Tendency for generous buyThresholds: Many AI would really start profiting when their parameters would let them buy almost all the stocks in the training batch. I attribute this to diversification. It's impossible to guess who will actually do well, but in long trials like this (sample data was taken over a 2 year time windows) most stocks will trend up and you do better to suck up a few losses and make up for it with the rest. The top performers would typically drop some stocks early as needed so losses were minimized.
Of course this program did not account for fees or trading expenses, which have very real implications on any serious trading application. Nevertheless it accomplished its purpose as a fun experiment and educational project.
Further experimentation
There's also a great knowledgebase in their forums and blog posts on algotrading techniques and methods. Reddit's algotrading subreddit is also a source of great information, if you're into this type of content.
Also a group of very smart people made a more robust suite of trading infrastructure tools called backtrader here. My main goal with this project was to play with Python and integrate some db tools with genetic mutation and do some optimizing. If I actually wanted to make money I would probably use backtrader. ;)
Data Acquisition
- Python Pandas Datareader: Used to download stock data via Yahoo Finance API
- SQLAlchemy: Python SQL mapper to write my stock data to postgres so I could do testing without waiting on a download
- Postgres: Local "cache" of stock data
Batches of ~20 companies from the S&P 500 for each trial, kindly enumerated here.
Show us the code!
for generation in range(util.MAX_GENERATIONS):
    for sample in population:
        sample.reset()

    for sample in population:
        sample.train(training_stocks, debug)

    # Sort by fitness, best first
    population.sort(key=operator.attrgetter('score'), reverse=True)
    print_progress(population, generation)

    # If only one agent has nonzero score, clone him to base the next generation
    # off the only decent specimen
    top = [ai for ai in population if ai.score == population[0].score]
    if len(top) == 1:
        top.append(population[1])

    # Make lots of mutants based off of the top two
    population = update_population(random.sample(top, 2), generation)

    best.append(copy.deepcopy(population[0]))

bestList = [stock.max_profit() for stock in training_stocks]
optimal = numpy.sum(bestList)
util.graph_results(best, optimal)
Sample output
--------------------------------------------------------------------------------
                         Wall-e Street Stock Market AI
--------------------------------------------------------------------------------

----------------------------------Generation 0----------------------------------
AI parameters: maxLoss[-0.223%] desiredProfit[11.744%] buyThreshold[-5.000%]
   19 stocks purchased, average return: 12.907%
AI parameters: maxLoss[-1.941%] desiredProfit[4.916%] buyThreshold[-4.924%]
   19 stocks purchased, average return: 12.764%
----------------------------------Generation 1----------------------------------
AI parameters: maxLoss[-5.218%] desiredProfit[2.252%] buyThreshold[-8.922%]
   19 stocks purchased, average return: 13.156%
AI parameters: maxLoss[-0.223%] desiredProfit[11.744%] buyThreshold[-5.000%]
   19 stocks purchased, average return: 12.907%
----------------------------------Generation 2----------------------------------
AI parameters: maxLoss[-5.218%] desiredProfit[2.252%] buyThreshold[-8.922%]
   19 stocks purchased, average return: 13.156%
AI parameters: maxLoss[-4.824%] desiredProfit[2.252%] buyThreshold[-3.891%]
   19 stocks purchased, average return: 13.156%
.....
---------------------------------Generation 247---------------------------------
AI parameters: maxLoss[-0.203%] desiredProfit[3.823%] buyThreshold[-31.285%]
   19 stocks purchased, average return: 14.902%
AI parameters: maxLoss[-0.203%] desiredProfit[3.823%] buyThreshold[-18.310%]
   19 stocks purchased, average return: 14.902%
---------------------------------Generation 248---------------------------------
AI parameters: maxLoss[-0.203%] desiredProfit[3.823%] buyThreshold[-18.310%]
   19 stocks purchased, average return: 14.902%
AI parameters: maxLoss[-0.203%] desiredProfit[3.823%] buyThreshold[-31.285%]
   19 stocks purchased, average return: 14.902%
---------------------------------Generation 249---------------------------------
AI parameters: maxLoss[-0.203%] desiredProfit[3.823%] buyThreshold[-31.285%]
   19 stocks purchased, average return: 14.902%
AI parameters: maxLoss[-0.203%] desiredProfit[3.823%] buyThreshold[-27.907%]
   19 stocks purchased, average return: 14.902%

Training time period used: July 2001 to June 2005
Gen 1 score: 12.764083748, Last gen score: 14.9022442532

Stock data used in this experiment
[AMT  ] Optimal:   1.17
[CERN ] Optimal:   1.89
[CHD  ] Optimal:   0.46
[CME  ] Optimal:   1.71
[DO   ] Optimal:   1.59
[EL   ] Optimal:   0.46
[FL   ] Optimal:   1.23
[GPN  ] Optimal:   0.99
[JCI  ] Optimal:   0.92
[KO   ] Optimal:   0.14
[MAS  ] Optimal:   0.59
[MCD  ] Optimal:   0.55
[MDT  ] Optimal:   0.14
[MOS  ] Optimal:   1.73
[MRK  ] Optimal:   0.02
[PFE  ] Optimal:   0.14
[SWN  ] Optimal:   3.83
[TYC  ] Optimal:   0.92
[XL   ] Optimal:   0.01